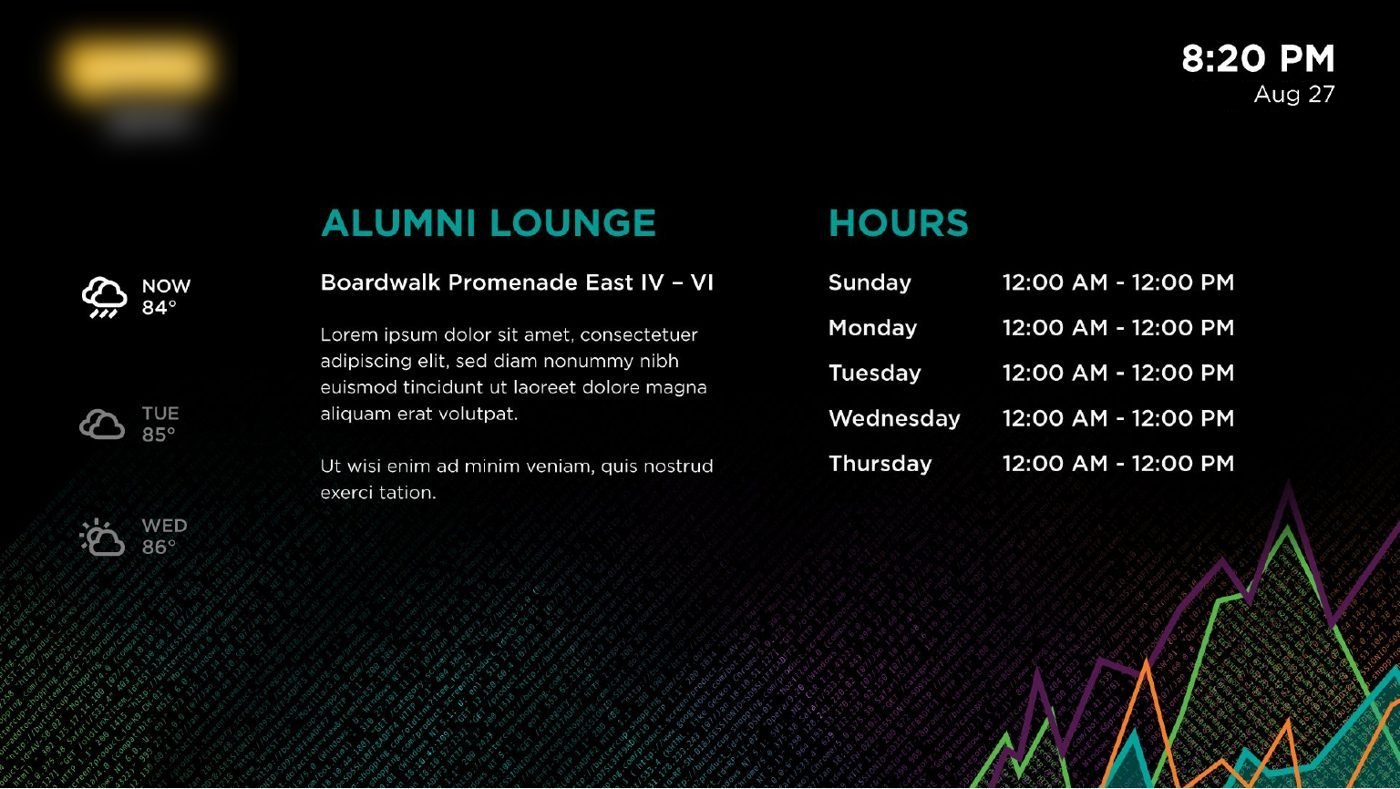
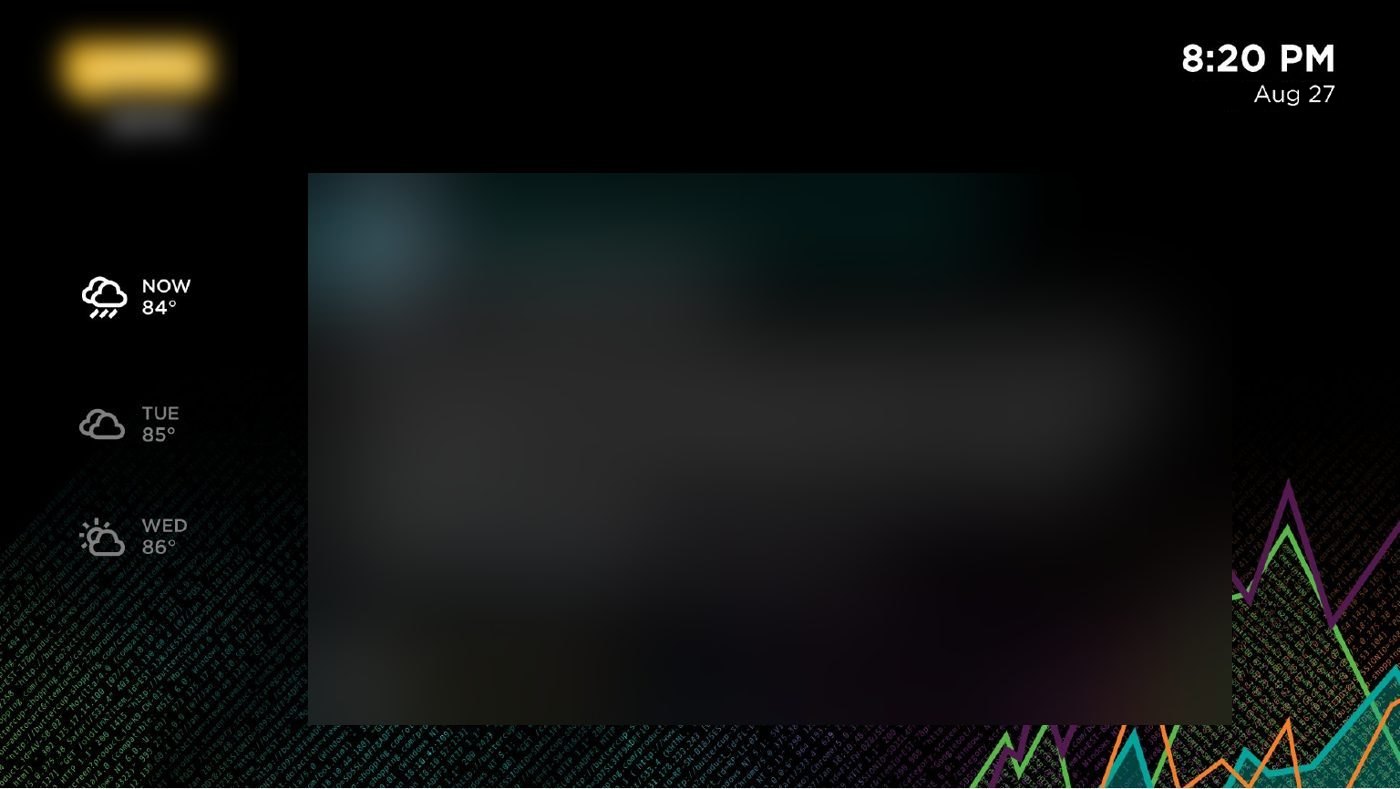
Landscape area hours template. Live clock and three-day weather, with the line-graph background looping behind the content. Client logos are blurred throughout.
Case study · Environment & Signage
A data-driven signage system for an enterprise data software company's annual user conference: 13 screen templates in landscape and portrait, built from wireframes to looping data-viz motion to live content, and run on site from doors open to close.
Landscape area hours template. Live clock and three-day weather, with the line-graph background looping behind the content. Client logos are blurred throughout.
The brief
The client's events lead had worked with me on signage for another major tech conference and brought me in for this one. There was no brief for the screens, so I wrote one: what attendees need to see as they move through a multi-hotel campus, how long they stand in front of each screen, and how the company's own story about data could show up in the signage itself.
With a creative director, I turned that into a pitch deck with options and budgets for each. The client picked from the menu, and the budget was awarded against that scope.
The process
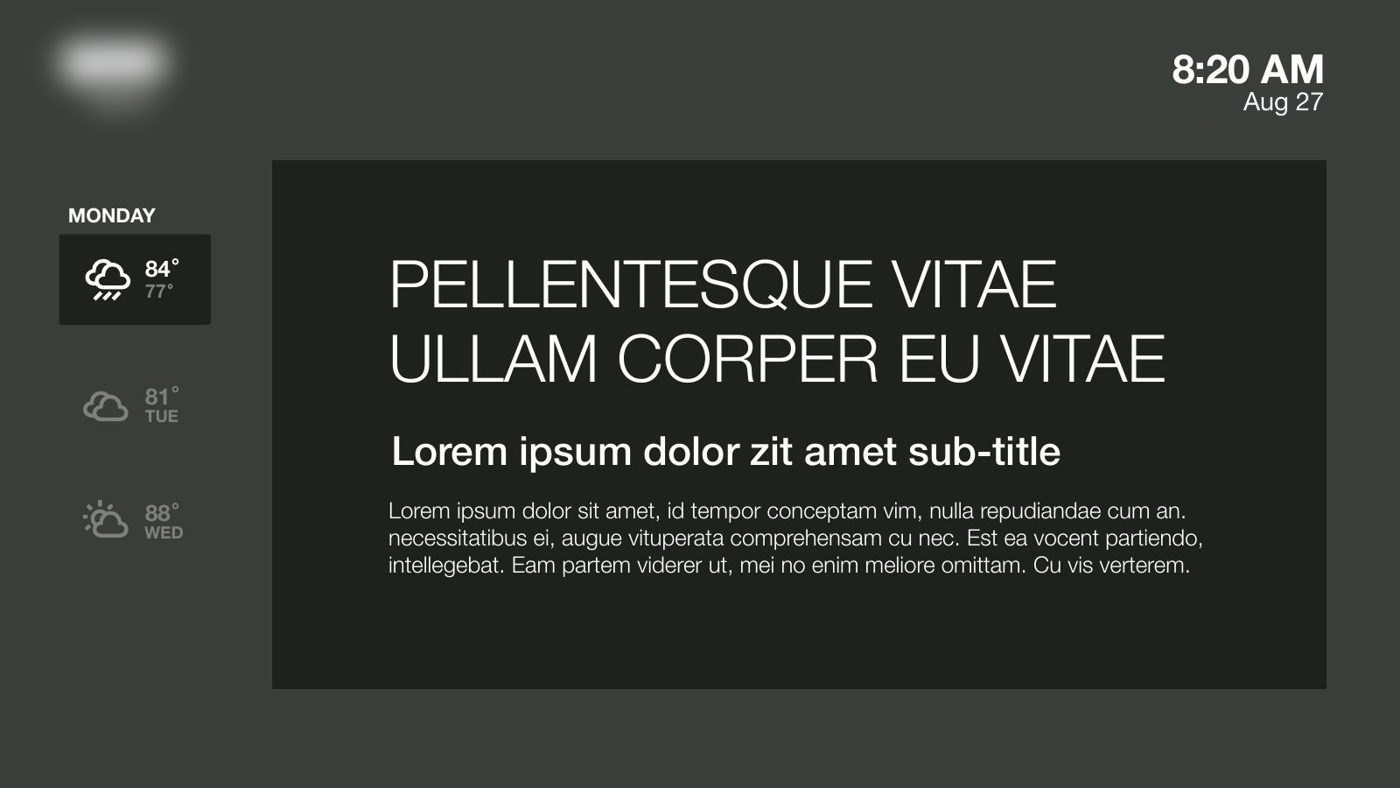
Grayscale layouts for every screen type and orientation. They locked the grid first: logo, clock and weather positions, safe zones, and where live data drops in. Design and development could then work in parallel without moving the layout.
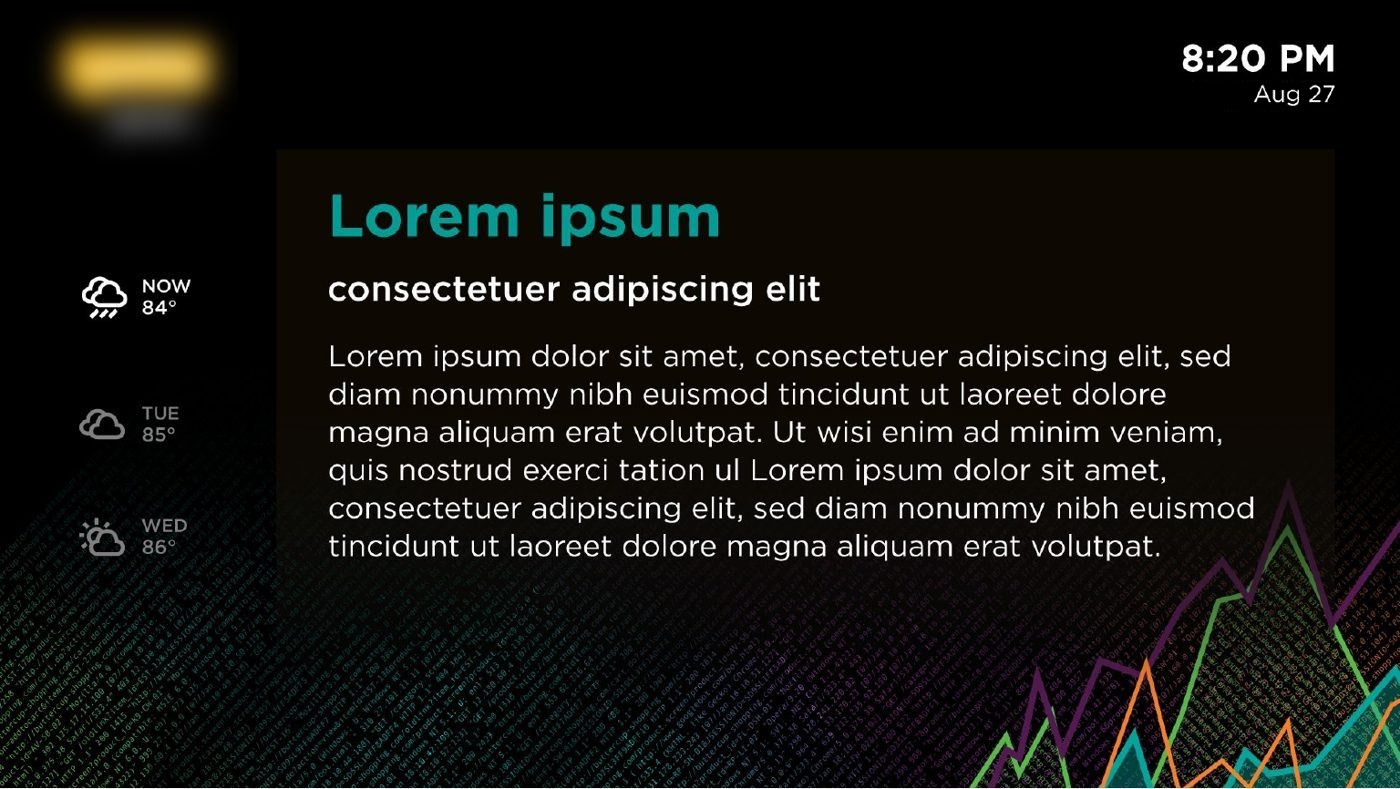
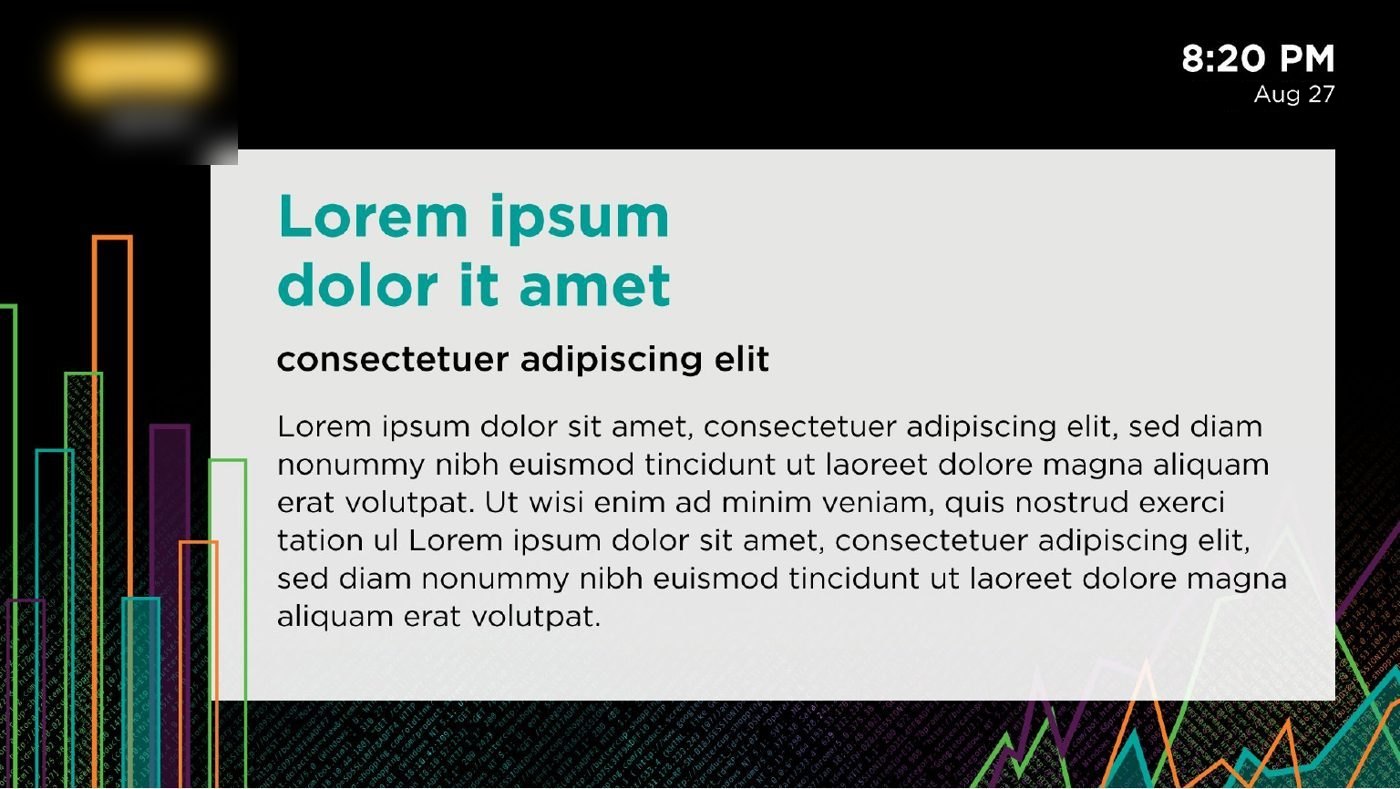
The client's software turns machine data into pictures, so the backgrounds do the same: scrolling code, line graphs and bar graphs in the brand palette. I built the motion templates as seamless loops sized for each screen format, so content could sit on top of any of them.
I set up the content streams, one for each kind of information attendees needed: session schedules, area hours, social feeds, event photography, wayfinding, sponsor content, and calls to action for on-site activations. Then I created the content for every stream and built the playlists that set which streams ran on which screens, in what order, and at what times of day. I built the run of show for each stream, so every screen knew what to play, when, and where. Each template carried notes on which animation it used and which data fed it.
I managed the screens live for all four days. Breakout screens showed the room schedule while sessions ran, then flipped to promotional and sponsor content when the room was empty. Wayfinding content moved attendees to and from general session.
Wireframe to finished screen
The template system
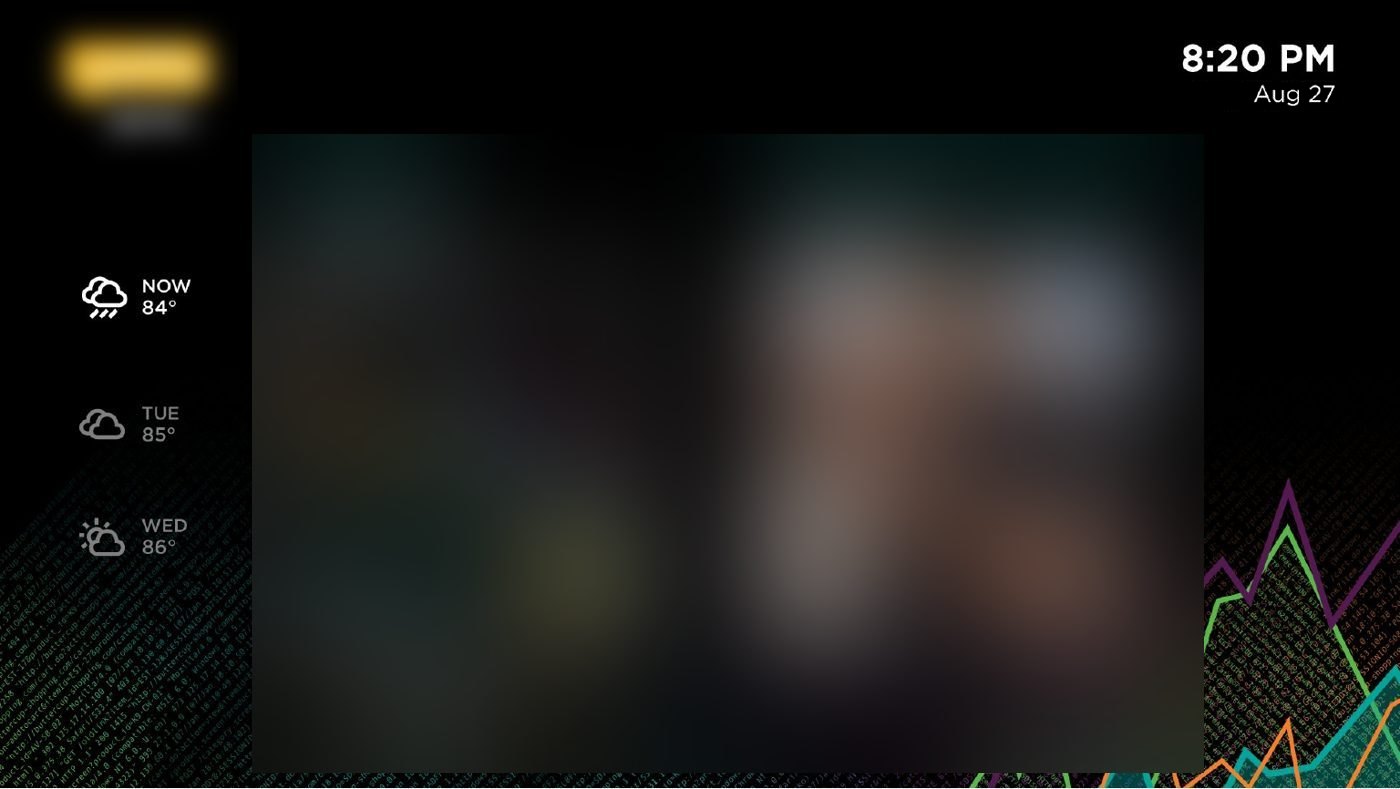
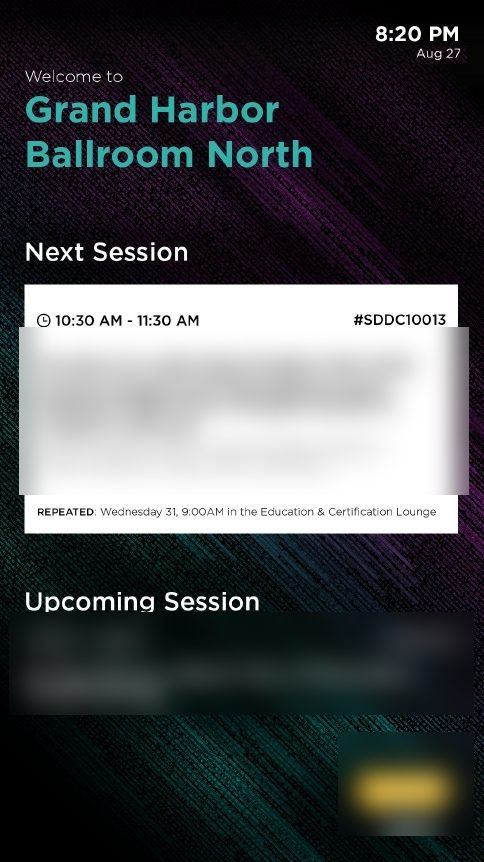
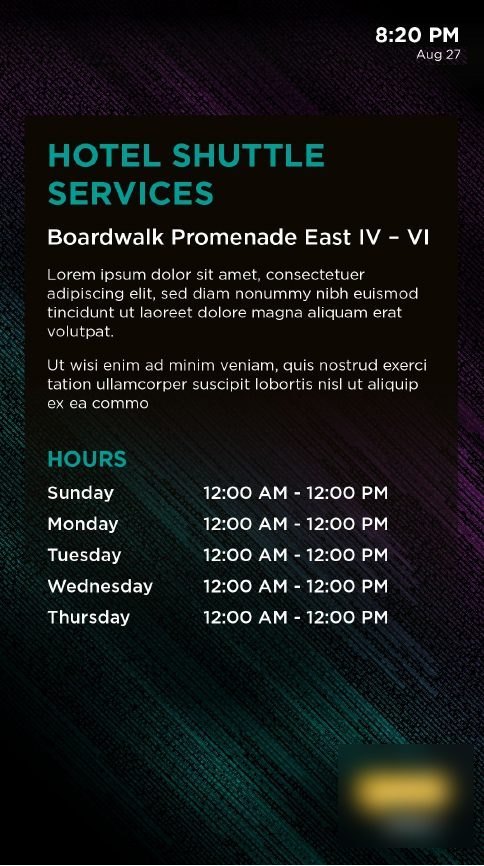
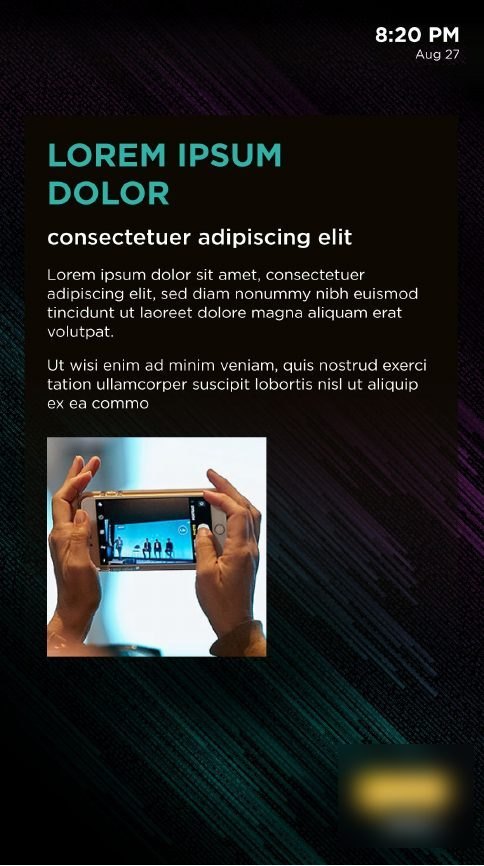
Every template shared the same header, clock and logo positions so attendees learned where to look. Motion and live data were assigned per template.
| Template | Format | Background motion | Live data |
|---|---|---|---|
| General information | Landscape | codeline graph | Clock, date, 3-day weather |
| Inside breakout | Landscape | codeline graphbar graph | Clock, date |
| Area hours | Landscape | codeline graphbar graph | Location and daily hours |
| Twitter feed | Landscape | codeline graph | Event hashtag posts |
| Instagram feed | Landscape | codeline graph | Event hashtag posts |
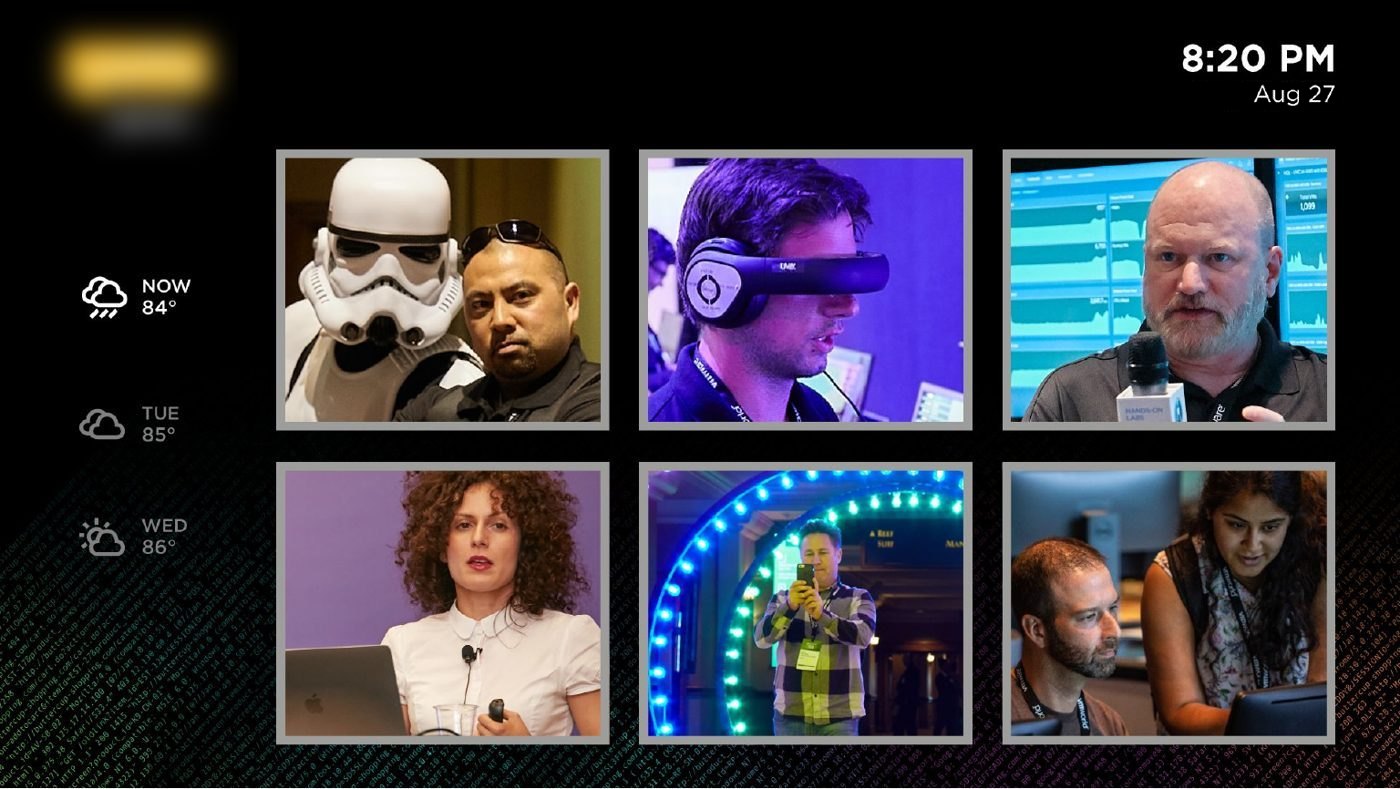
| Multi-image photography | Landscape | code | Event photography |
| Full-screen photography (2 variants) | Landscape | None | Photo and caption |
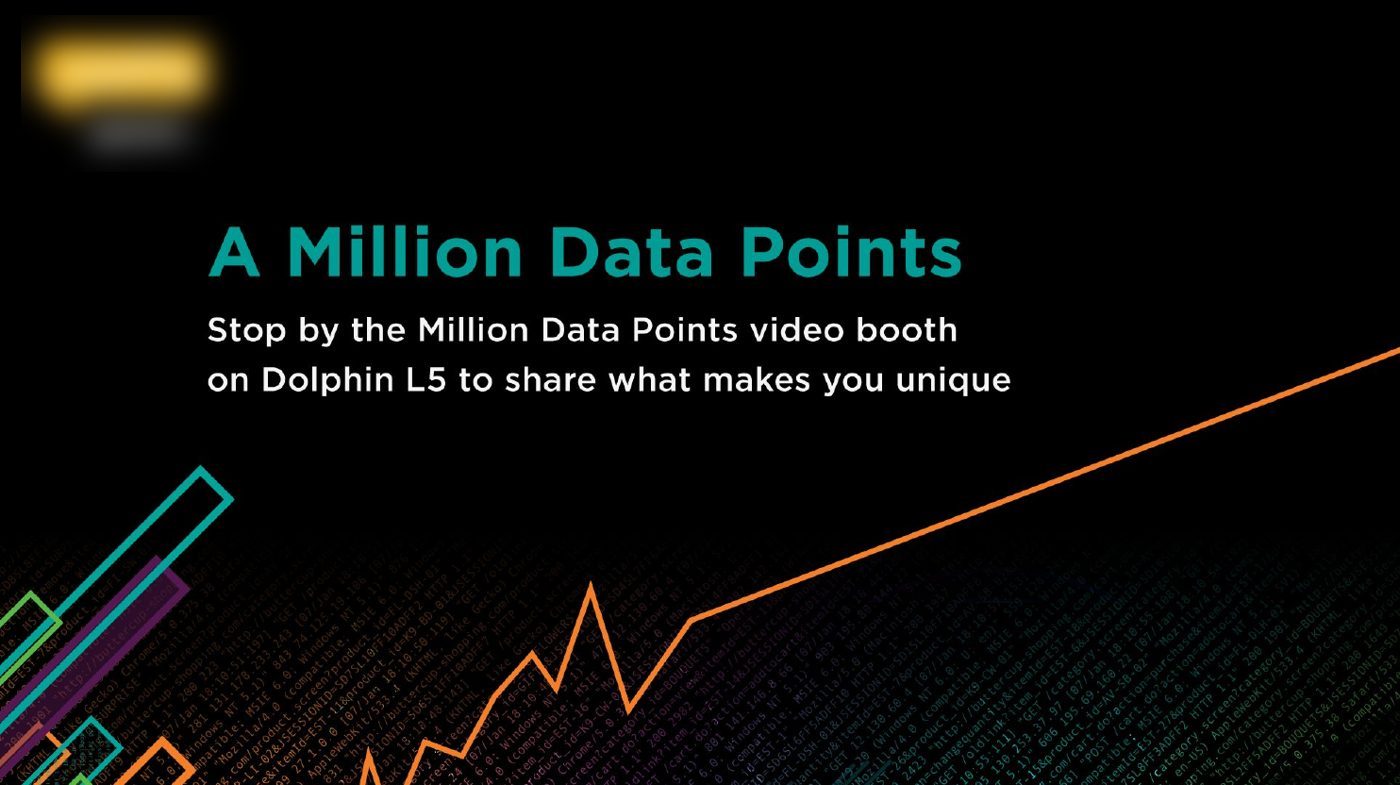
| Video call to action | Landscape | line graph | On-site activation promo |
| Breakout | Portrait | codeloop | Room, current and next session |
| General information | Portrait | codeloop | Clock, date |
| Area hours | Portrait | codeloop | Location and daily hours |
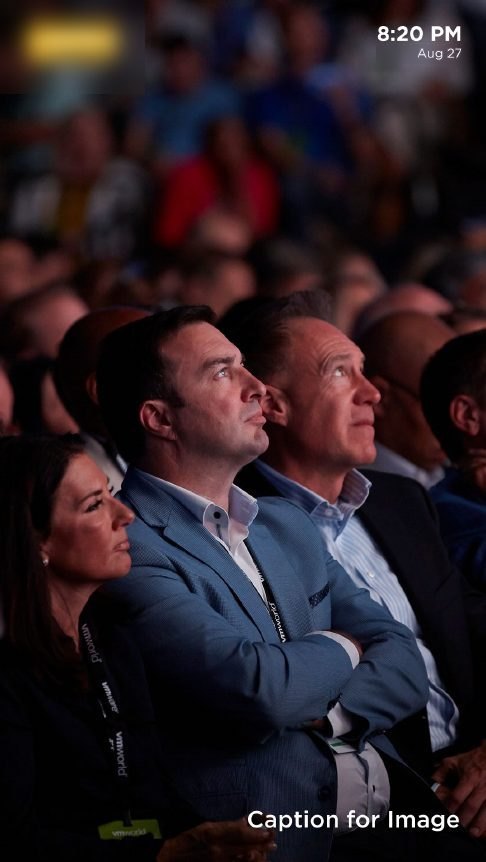
| Full-screen photography | Portrait | None | Photo and caption |
Finished templates
What I owned
Scope: digital signage content and screen operations within the event. The general session and stage production were run by the client's event team and partners.